The methods we use on engagements are built into two platforms, so a client keeps the model as well as the report.
LOSS RATIO SPLIT · SAMPLEPLATFORM 01
ATTRITIONAL58%
LARGE LOSS24%
CATASTROPHE12%
SAMPLE PORTFOLIO ATOTAL LOSS RATIO 94%
Universe
The reinsurance pricing workbench.
Pricing workflows for proportional and non-proportional treaties, loss development, large-loss and catastrophe curve fitting, and portfolio intelligence, in one place.
A treaty placement tool for reinsurance brokers. Cedant submissions are extracted into one canonical data model, then assembled into a renewal pack ready for market.
TREATY PLACEMENTDATA EXTRACTIONRENEWAL PACKS
INSIDE UNIVERSE
Four screens an underwriter lives in.
Screens from the working platform. No client names appear.
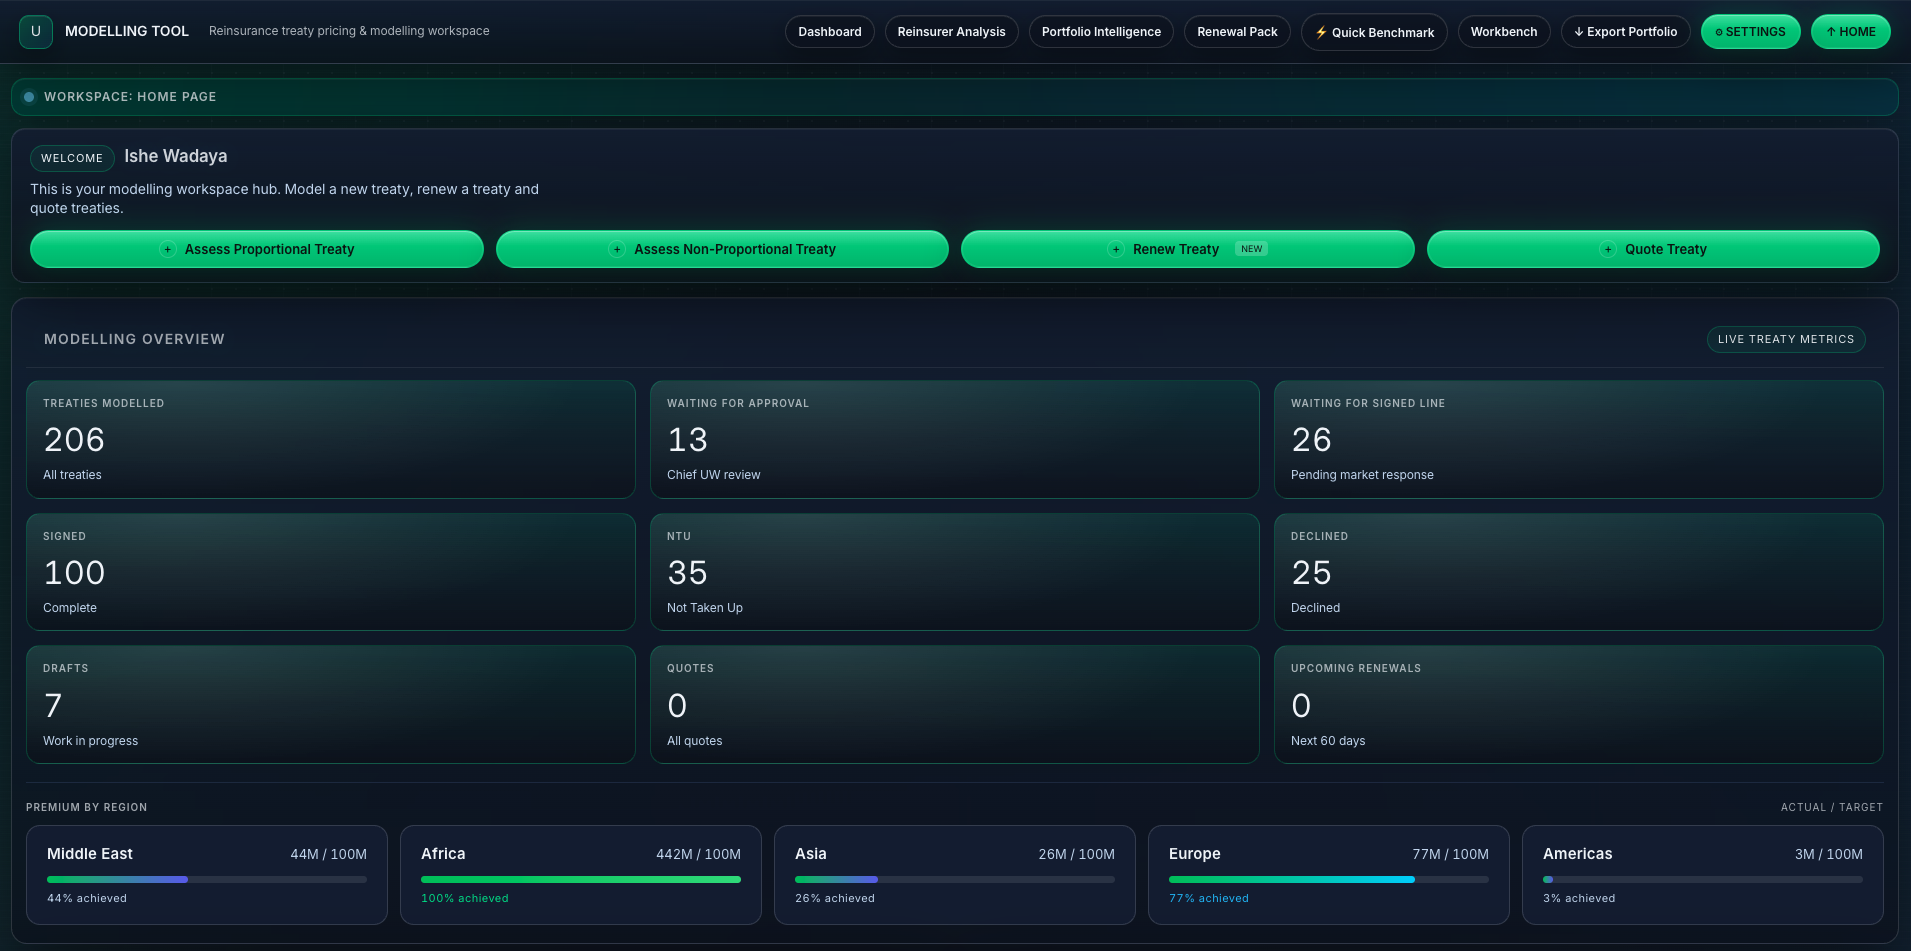
universe / home
Treaty dashboard. The underwriter's home page: start, renew or quote a treaty, see every treaty by stage, and track premium against target in each region. Swipe the screen sideways to see all of it.
Large LossesCAT LossesRisk ProfilesClaims ProfilesCresta AggregatesCedant SummaryChecklistInternal MetricsTreaty MetricsCompare Terms
Underwriter Comment
Pricing rationale…
↓ Export ExcelOffer TreatyDecline
Pricing page. Loss drivers, treaty structure and profitability for the whole treaty on one screen, colour-coded against the thresholds an underwriter cares about. Swipe the screen sideways to see all of it.
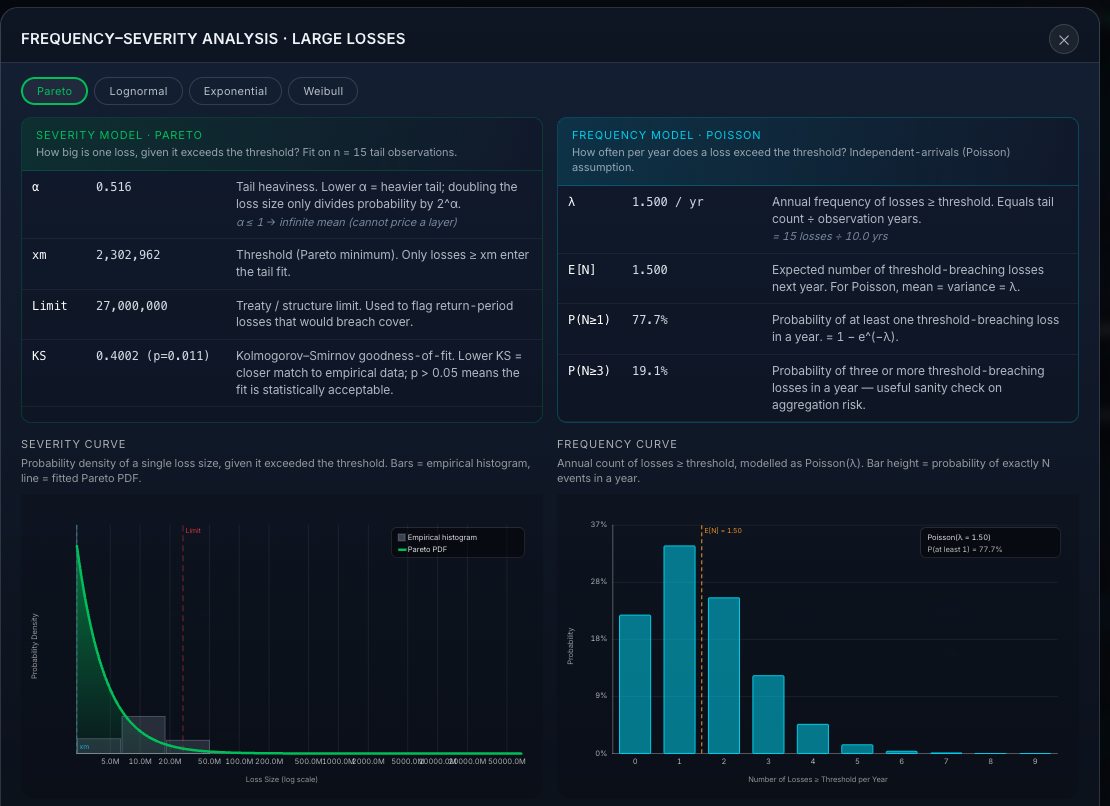
Pareto curves. The frequency-severity analysis: a fitted Pareto severity model beside a Poisson frequency model, each parameter explained in plain terms, with both curves drawn beneath. Swipe the screen sideways to see all of it.
Offer TreatyViewing as UnderwriterDRAFT✕
1Draft
2Awaiting Approval
3Awaiting Signed Line
4Signed/Complete
Written Line
7.5%
100% PremiumUSD 25,000,000
100% LimitUSD 60,000,000
100% Event LimitUSD 120,000,000
Line PremiumUSD 1,875,000
Line LimitUSD 4,500,000
Authority MaxUSD 50,000,000
Underwriter Mandates
✓Within authority limit
✓Mandated classes only
✦ AI Suggested Line SizeApply →
8.0%
Margin is positive and the line stays well inside authority, so a mid-sized share is supported.
Send toSelect approver… ▾CloseSubmit for Approval →
Offer share modal. The underwriter sets the share to write, checks it against authority and an AI-suggested line, and sends it for approval through a four-eyes workflow. Swipe the screen sideways to see all of it.